|
In my previous blog piece – Momentum or Serious Retracement -, I stated that if Bitcoin were to break the $8300 resistance (at that time), it would hit $9000. It did even if for a short time. The Bitcoin rally over the last few weeks has been to an extent FOMO (Fear of Missing Out) based. I am sure there are other factors involved, but let’s put them aside. Thus, what is maximum FOMO? This is only when the marketplace comes to a stage where we will experience a major retracement in the price of Bitcoin. In my lowly view, I don’t believe we are at maximum FOMO. Here are some of my reasons why: 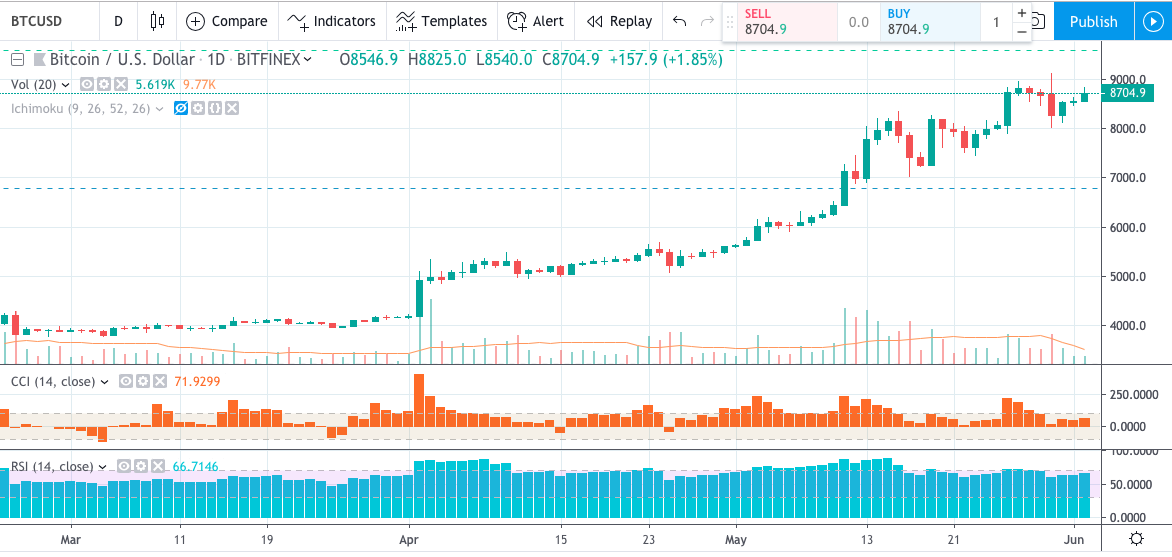 Bitcoin Daily Price Courtesy Tradingview Firstly, I believe there are people still interested in investing in the Bitcoin market. I think that when we see prices return to $9000 levels, then we will see a rush into the market. Maximum FOMO may then be hit at the $9500 - $10000 levels. I back this up by looking at the BTC price levels on the higher timeframes. The BTC weekly chart shows the overbought levels in the RSI (Relative Strength Index) indicator. The monthly timeframe has also shown overbought levels. 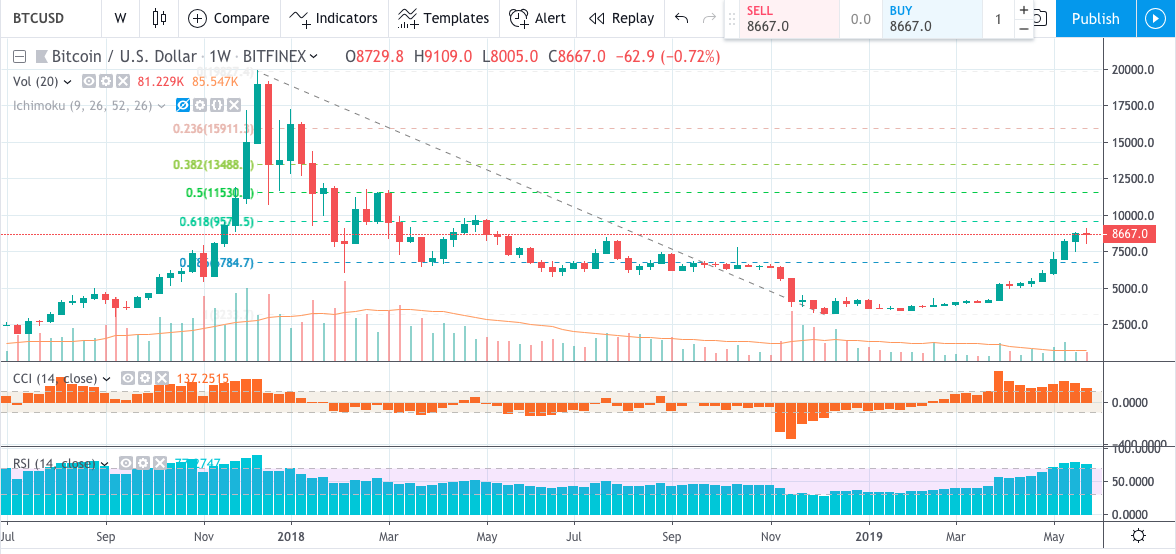 Bitcoin Weekly Chart Courtesy Tradingview Secondly, I mentioned the $9500 levels because the Fibonacci retracement level of 61.8% shows resistance. We can also see that there has been a significant overbought activity for the month of May. Thirdly, Bitcoin has been on a bullish-run with almost no retracement whatsoever. Many are wondering when this will occur. There is some sentiment that this could happen any time soon. We know that BTC has a history of bullish-runs in the past and this is no exception. However, what occurred on Thursday did shake a few up. I believe should the Bitcoin price fall below $8000 then a major retracement is on. Bitcoin price action, on the other hand, may say otherwise. As we all know, the market will do what it wants regardless of how we feel. All we can do is be vigilant for what may occur. And as to when exactly maximum FOMO might happen, your guess is as good as mine.
0 Comments
You would have to be deaf, and blind not to notice the commentary on Bitcoin at the minute. With the parabolic rise of this cryptocurrency come a plethora of thoughts. Some believe BTC $50 - $100k next while others submit it may fall to $3k. As many a trader will tell you, always look to the higher timeframe to deliver an indication as to what the price of a cryptocurrency, stock, or instrument might be. I studied recent Bitcoin charts this way, and here is what I discovered. I trade BTC on daily charts and not hourly. Because of this, I look at the weekly charts for guidance. Sometimes I look to the monthly charts for more guidance. The weekly charts show you that there may be some momentum left in Bitcoin. Appearing at the chart below, you will understand that the momentum indicator has proven strength in the trend for the last eight weeks. The indicator shows no sign of momentum dropping any time shortly. In other words, the momentum is very bullish. This (momentum) may dissipate in about three weeks, and bring about a retracement. You may have also noted that there is some resistance at the $8300 mark. I think that if Bitcoin breaks this resistance, $9000 is certainly on the cards before any future drop in price. Like so many of you, I would love owning a crystal ball telling me the future price of Bitcoin, unfortunately, this is not the case. And since it is not the case, your guess is as good as mine. BTC Weekly Charts with Momentum and CCI Indicators Courtesy Investing.com
I am a regular competitor on the Cindicator platform. One of the questions asked was what we thought the maximum and minimum Bitcoin prices might be by the end of the day. This type of question was asked fairly regularly so I made my predictions. Bitcoin it turns out made such a price jump that I ended up losing a large number of points for getting it wrong. Many pundits/analysts got it wrong. They like many did not see the coming parabolic move. 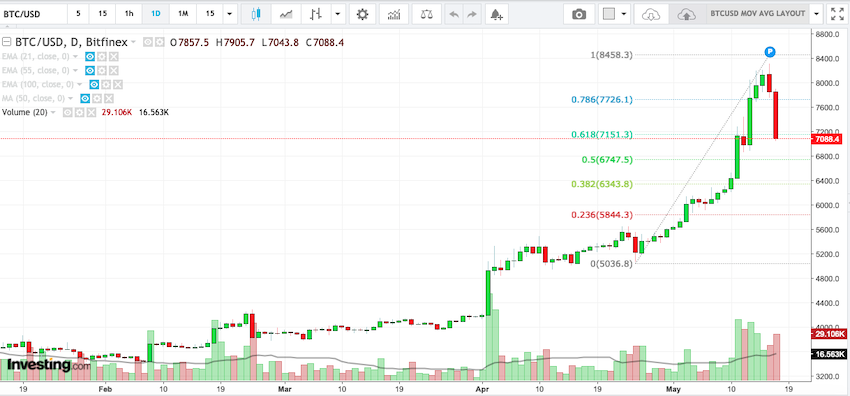 Bitcoin Price with Retracement Courtesy Investing.com Next, there was the talk of Bitcoin going as high as $25k. Some even posited $250k! Between 26 April and 15 May, we saw the massive price rise driven by FOMO (fear of missing out). BTC price went as high as $8323. The enthusiasts among us must have thought prices were headed back to $20k! Alas, this doesn’t seem to be the case. As I write there has been a retracement to 61.8%. Volatility and uncertainty are characteristics associated with Bitcoin. They are not going anywhere. It looks like Bitcoin’s price is going to infinity but not beyond. Who knows what’s next, but then again, your guess is as good as mine.
At about 7 pm CAT (Central African Time) yesterday, I noticed that the BTC price on Bitfnex was more on par with other exchanges. I had to do a double take. I thought there must be some mistake. One had to wonder, is it the price premium outcry or something else that has made this happen. I could think of no reason. Some of you may recall that my last blog piece was precisely about the Bitfinex BTC price premium. Historically, there has always been a more visible difference when it comes to Bitfinex and other exchanges. 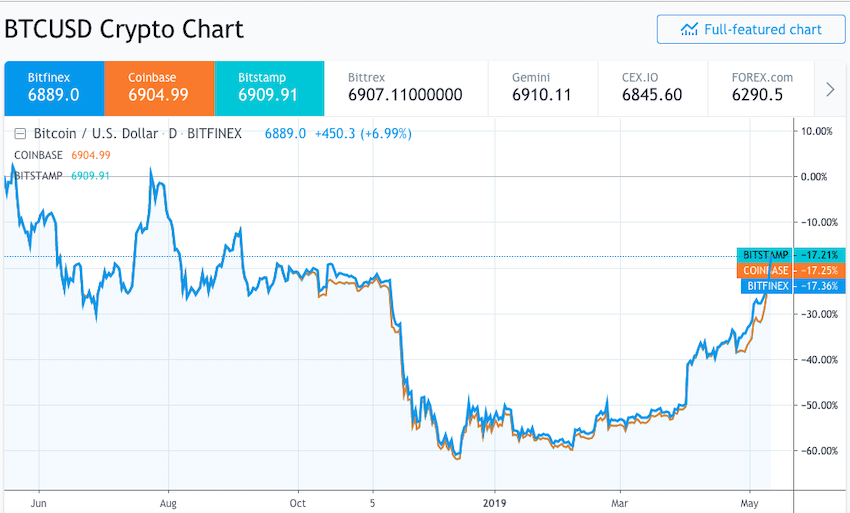 Cryptocurrency Exchange Bitcoin Prices Courtesy Tradingview I began to reconsider my earlier thoughts. What really has brought about the shrinking Bitfinex BTC premium? I thought of a few reasons that may have brought this about. Earlier in the week, Bitfinex made an announcement on receiving both hard and soft commitments of a $1 Billion towards its’ exchange token. This was according to one of the shareholders involved in the process. Could this be one of the reasons? Let us not forget the outcry by many in the crypto community. Might this have been another reason? We must also think about Bitcoin volatility. Recent prices surges will as they do even up the costs across the different the crypto exchanges because of an increase in demand right across the board. Might there be something else we are not considering or is there just a simpler explanation? Maybe there is an easier explanation but then again your guess is as good as mine.
Recent reports indicate that something fishy may be going on in the cryptocurrency markets. The point in case is Bitfinex. It is believed that Bitfinex is skewing the price of Bitcoin. This has concerned the likes of CoinMarketCap to the point that it has stopped listing Bitfinex prices. I had initially thought this impossible, but on investigation, it turned out to be so. Taking a quick glance at the Bitcoin price, you will immediately see the disparity. What this means is that the Bitcoin price on Coinbase, Bitstamp. Bittrex, Gemini, and OKCoin are pretty similar. For those who love arbitrage, there are no opportunities to take advantage of. The weighted average price is $5821.43 (at the time of writing) while the price on Bitfinex is $6121.6. This is a difference of $300.17! Such a difference should be cause for concern. 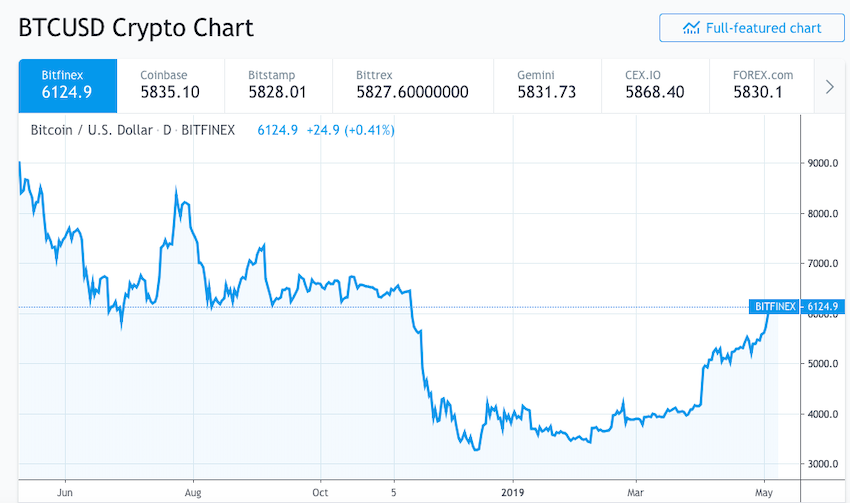 Bitcoin Chart Courtesy TradingView New York State Attorney has also announced an investigation into the conduct of Bitfinex, Tether, and iFinex for what appears to be a series of bank transfer cover up of losses totaling $850 million. Many an analyst believes that this might bring on a new bearish sentiment in the market. That concern seems to have dissipated considering the current bullish sentiment in the price of Bitcoin. While the disparity of Bitfinex to other exchanges has brought on some concern, a counter argument could be brought forward concerning the exchanges Coinfloor and itBit. Their Bitcoin prices are $4376, and $3547.7 as at the time of writing. This is a difference of $1445.43, and $2273.73 respectively, when deducted from the weighted average. So, what is the real price of Bitcoin? Do we really know? I suppose not, but as I have always said, your guess is as good as mine.
The following blog piece is not financial advice nor is it encouragement to buy crypto assets of any kind. This is strictly for educational purposes. You have to be careful with your hard-earned money, in other words, do your due diligence before making any investment at all. Those who have read my earlier blog pieces will remember that I have mentioned the 200-weekly moving average (200-wma). You may have noticed that I have not done one of these blogs in a while. The main reason was Bitcoin’s sideways price movement. A close watch was required, especially for breakouts to a bullish pattern. Bitcoin Price with 200-Weekly Moving Average One of the ways to keep a more critical eye on the price movement is via the 200-wma. Historically and statistically, markets have been known to bottom at the 200-wma. It is the same for crypto markets. Bitcoin’s previous low of $3238 – on the Bitfinex chart – may be tested once more. If that happens and $3238 becomes the support level, then the downward price pattern may come to an end. If this is the case, a bullish pattern may then follow. Having said that, the 200-wma is one of the easiest and quickest ways to keep an eye on the future price movement of Bitcoin. As is always the case, we can never tell what might actually happen, but then again, your guess is as good as mine.
Yesterday I put out a piece talking about the price of Bitcoin. I mentioned the next possible price drops that may occur. The first was $4571, and the second $3454. It was to my astonishment that the first of the two drops had been attained. I never expected it to be that quick. With the current RSI in oversold levels, contrarians are looking to pick up some BTC at what is considered to be cheap. RSI, as I write, is at 12.26 and the price of BTC has somewhat recovered at $4920 having been as low as $4416. I would ask the adventurous among us to be cautious. RSI might be at an oversold level but the price may recover for a little while before dropping even further. Any further drop and I suspect that the price level - $3435 – will be next. One quick reminder, the BTC price has been below the 21-day EMA (Exponential Moving Average) for a little while now, which indicates a highly bearish tendency. The lack of certainty in price direction is what makes this market interesting. As always, no one knows what might happen at any particular moment but then again, your guess is as good as mine.
It’s 7 pm CAT (Central African Time) and I am in my office trying to finish off a report for a client when I get a Telegram message from a friend: “WTF is going on with Bitcoin; why is the price falling?” The message sort of disturbed my evening of work. I had not looked at the crypto market for a few days as things had remained flat for a while. Now we had this sudden movement with nothing prompting it. I had a quick look at the BTC chart is here is what I saw: One thing I know about any market is that nothing happens without a reason. Several reasons came to mind without any particular clarity. It was time to seek why this was happening. I first thought that some trader’s bot/s had gone haywire triggering others to do the same. Nevertheless, scanning some of the news sites brought other things to light. Several governments across the planet have said they will begin to tax holders of Bitcoin, the United States and South Africa come to mind. I was intrigued to read about some crypto hodlers selling out their positions to cover taxes owed. Could this be possible, maybe but not enough to trigger a massive sell off except that seller is a really big whale. Perhaps the most pertinent reason for the sell off was the upcoming Bitcoin Cash hard fork. A hard fork is essentially the splitting of a cryptocurrency into two or more new currencies. At that time, Bitcoin Cash (BCC) was to be split into Bitcoin ABC (core Bitcoin Cash), and Bitcoin SV (Satoshi’s Vision). Bitcoin Cash had been volatile as a currency precisely because of the potential hard fork, which in turn may have affected the crypto market as a whole. We must not forget the civil war going on in the BCC community. This surely had some impact on the sudden drop in the crypto market. Some of us may argue that the weakness in the US stock markets might have had some impact no matter how small. Maybe investors were just spooked and decided to sell. This argument can be countered. I think we can safely ignore the pundits going on about BTC $50k, and question where BTC price will go. For starters, BTC broke a key market structure. This was breaking the $6000 mark. As of this blog, the price is at $5251.7 having fallen even lower earlier today. Relative Strength Index (RSI) is also at an oversold level. Oversold levels may mean a bounce back to previous resistance but no one can really tell whether that will happen. If no bounce then it may mean that things are now officially bearish. Another key thing is on the BTC weekly chart. You may notice that the BTC price has broken the 21-day EMA. This may be a signal to indicate a true bearish sentiment. In a bearish environment what price levels are we talking about? We can give ourselves a rough deduction by using the symmetrical projections methodology. Also known as symmetry or equal drive, this is done by taking an equal measure of previous price highs and projecting them to the lower levels (apologies for not explaining the methodology properly, this will require a separate blog). This gives some idea as to what price may be in the future. The price estimates we arrived at were $4571 and $3435. Will Bitcoin fall to these levels, maybe. We have all witnessed the volatile nature of Bitcoin with no one really knowing what to expect in the months and years to come, but then again, your guess is as good as mine.
Recent matters to do with Bitcoin and other cryptocurrencies has left everyone short of breath. The price volatility alone is enough to give some a heart attack. Some pundits are now suggesting the price has bottomed out. Just this morning, 8.00 am CAT (Central African Time), bitcoin price fell from $6550 to $6355. There has since been a recovery to $6470. With such price swings are we really out of the woods? I am not so sure! Massive price fluctuations over every weekend now seem a given and is likely to continue. Looking at the today's’ chart, we see that the CCI (Commodity Channel Index) has been slowing down with a figure of -53.6550. It was almost twice this figure during the weekend at -103.9557. Trading volume looks healthy indicating the sorts of price movement we are currently experiencing. RSI (Relative Strength Index) is at 44.6515, which is also quite healthy. As for the clouds (Ichimoku), the tekan sen has gone below the kijun sen which is flattening out. Both the tenkan sen, kijun sen, and price candles are under the cloud telling us things are still bearish. How long it will remain this way is anyone’s guess. 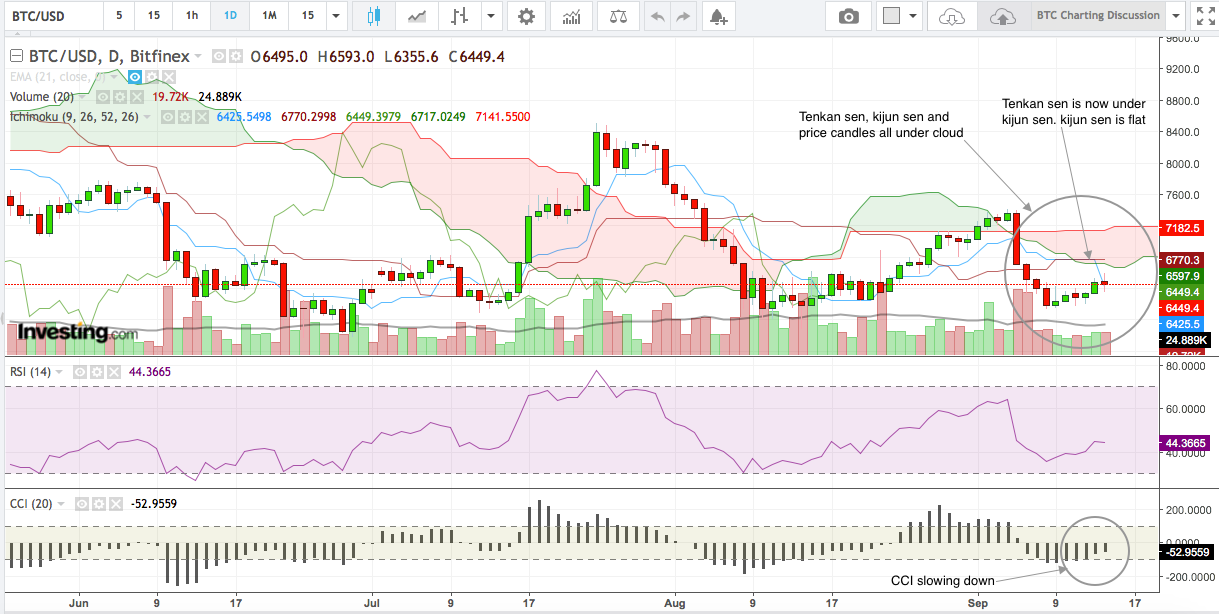 I suppose we can look forward (not!) to more volatility in the future. By now we should all be used to that. Volatility is unfortunately here to stay except someone comes up with a stable coin that is beyond outstanding. And as for certainty, that’s another thing. No one really knows what direction prices will take. As I have said before, this could be due to both animal spirits, and market manipulations. I have often joked that the price of Bitcoin will change if Vitalik Buterin changes his favourite coffee brand. Maybe this will stop one day, and we can have some peace, but then again, your guess is as good as mine.
Optimism seems to have returned to the land of crypto. Pundits and the like are back to calling bitcoin $20k once more. Some have even gone as high as $50k by October. One often wonders what these guys are smoking. Maybe I should have some too if only to have a peek into their perspective. As always, I look at what the charts are saying, and I don’t see bitcoin $20k just yet. Please note that I have not said it won’t go back to that range but not right now.  Looking at my charts indicate show a steady rise in the price of bitcoin. For those who are Fibonacci purists, bitcoin’s price has already gone through the 0.5 and has got close to the 0.382 level- $7110.6 and $7432 respectively. The RSI (Relative Strength Index) is on the rise but not at an oversold level just yet. The CCI (Commodity Chanel Index) also indicates that there is some momentum in the price rise. News from China on the cryptocurrency speculation clampdown as well as tighter regulations in South Korea has not dampened enthusiasm. Maybe this really is the expected rally. The omens are indeed looking good. We all know the crypto market is very fickle, and things do change suddenly but then again, your guess is as good as mine.
|
Swap your cryptos here:
Nosa Capital
Nosa Capital concentrates its' expertise in Strategy, Business Development, Project Management, Project Finance, Trending, and now cryptocurrencies Archives
November 2023
Categories
All
|

blogging
 RSS Feed
Photos from QuoteInspector, wuestenigel, Hektorej, SimpleFX, verchmarco, barbourians, Bestpicko, Noam A., verchmarco, verchmarco, wuestenigel, wuestenigel (CC BY 2.0), Casinolobby.dk, mr.ddenisov, focusonmore.com (CC BY 2.0), PerfectHue, b_d_solis, davidstewartgets, wuestenigel, afiler, wuestenigel, verchmarco, SimpleFX, nodstrum, wuestenigel, verchmarco (CC BY 2.0), wuestenigel, sirqitous, TheAlieness GiselaGiardino²³, QuoteInspector, wuestenigel, marcoverch, Jorge Franganillo, verchmarco, wuestenigel, wuestenigel, wuestenigel, wuestenigel, Jorge Franganillo, wuestenigel, TLC-kios, SimpleFX, SimpleFX, wuestenigel, wuestenigel, wuestenigel, wuestenigel, verchmarco, wuestenigel, Infosec Images, ttmarketing, Toolstotal, SimpleFX, wuestenigel, marcoverch, wuestenigel, focusonmore.com, Cryptodost, zcopley, btckeychain, Crypto360, QuoteInspector, wuestenigel, davidstewartgets, trendingtopics, Raisin - Finance Stock Images, wuestenigel, stockcatalog, verchmarco, focusonmore.com, wuestenigel, TwinPeaks99, orgalpari, marcoverch, orgalpari, arne-mueseler.com, orgalpari, Bestpicko, Jim Makos, wuestenigel, jane.boyko, Infosec Images, verchmarco, SimpleFX, stockcatalog, Bestpicko, mikemacmarketing, wuestenigel
