|
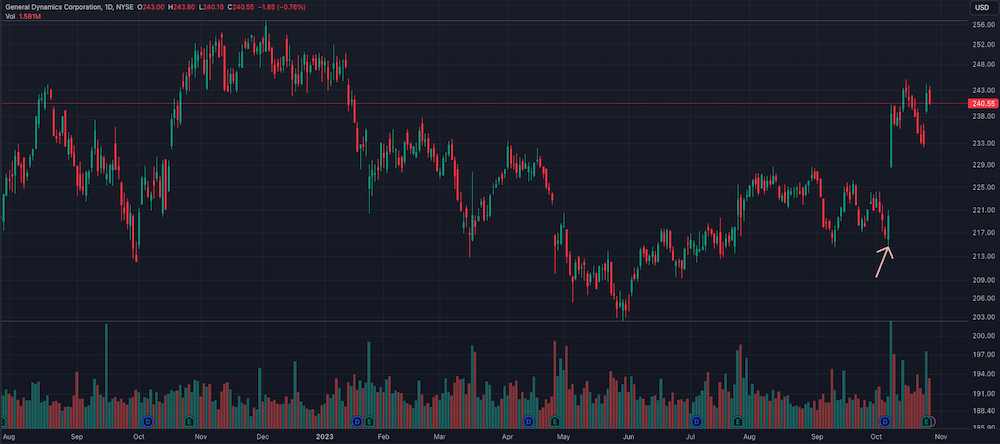
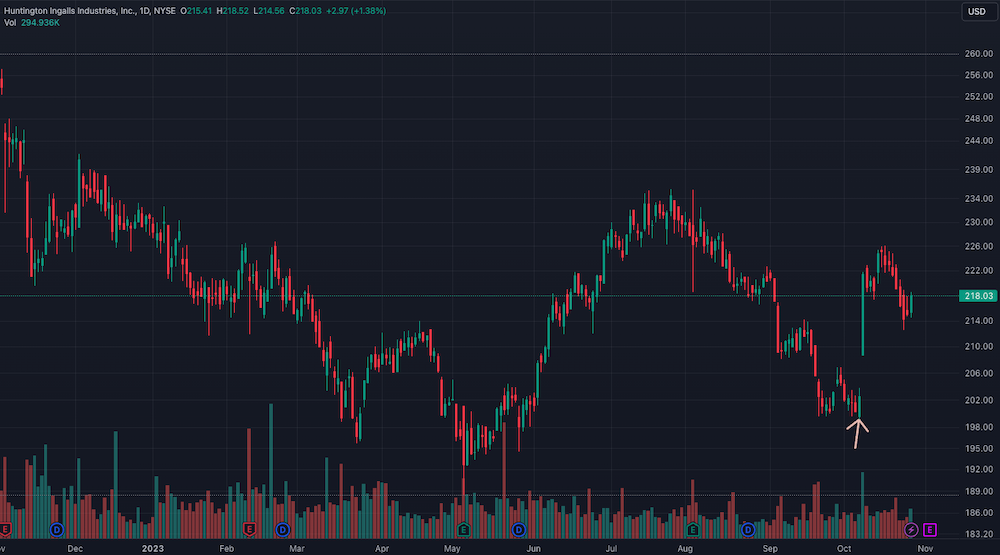
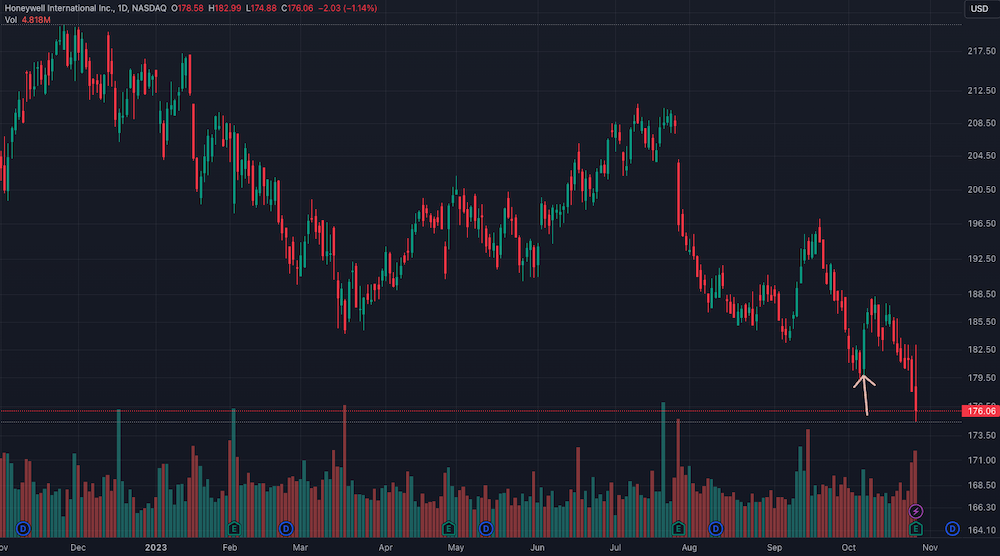
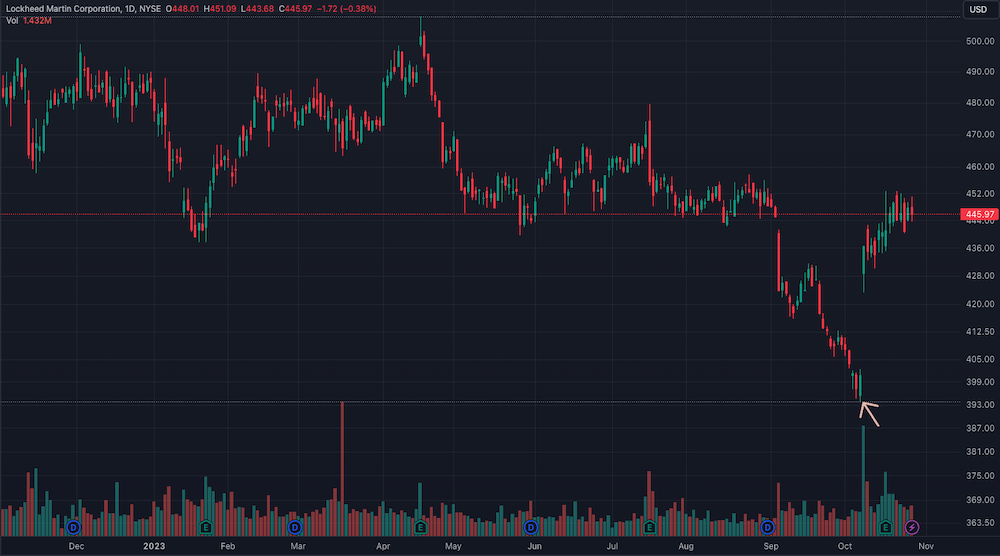
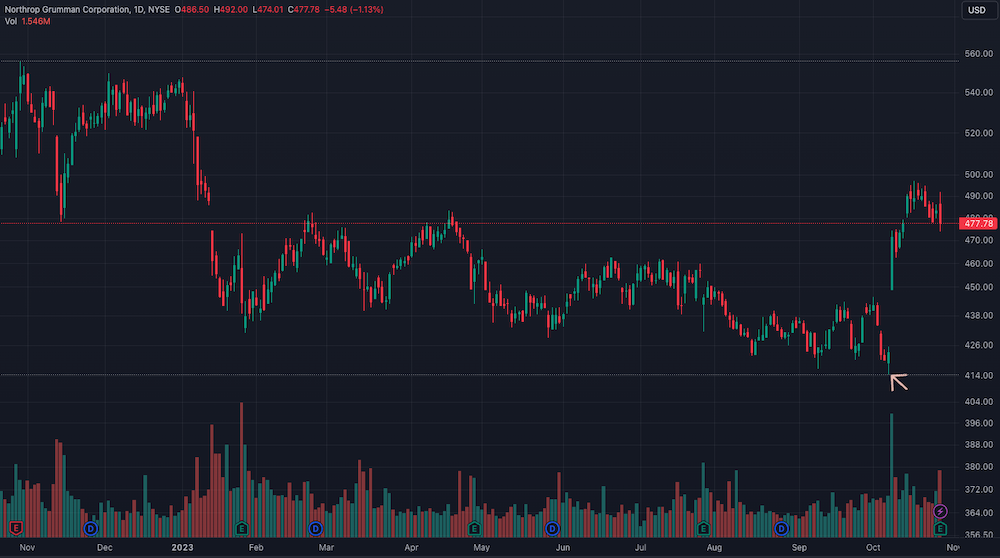
Barring living under a rock, you will know of the Israeli-Palestinian conflict. The Israeli-Palestinian troubles saturate the news at the moment. I happen to be an individual who doesn't spend time watching TV. Nevertheless, I remember the saying, "Never let a good crisis go to waste". Unfortunately, the Israeli-Palestinian matter is one of those times. For those who love documentaries, you may have heard of Planet Finance. "Planet Finance" is a documentary that investigates and explains the ever-changing monetary system and its impact on both national and international levels. One point from the documentary is that traders are neither sensitive nor sentimental when money is to be made in a crisis - a constant theme throughout the documentary. You will get to hear this from the horse's mouth. The current situation is no different. After everything said, it begs the question, did prominent people know of the impending situation and say nothing? Did they intend to profit from the chaos? I have no proof such a thing happened, nor am I saying this is the case. Remembering the sentiment in the documentary, I decided to check out some of the defence contractors on my trading platform. Looking at the charts, I noticed a lot of bullish-engulfing in several of these stocks. A Bullish Engulfing Pattern is a technical analysis pattern that signals a potential reversal from a downtrend to an uptrend. It consists of two candlesticks: a small bearish (red or black) candlestick and a larger bullish (green or white) candlestick that engulfs or covers the entire body of the previous candlestick. This pattern indicates that buying pressure has overcome selling pressure and suggests that the market trend is changing from a downtrend (bearish) to an uptrend (bullish). Perhaps the most important here is that this engulfing pattern was on the 6th of October. Here are a few examples: We all know the attack took place on the 7th of October. And, of course, defence contractor share prices went up quite a bit on the 9th of October. Is it possible some knew and took a position to profit? In hindsight, I wish I had kept a tweet I read on my timeline. It asked a similar question. While I have no proof, it would not surprise me that some profited handsomely. You may look at the charts and say prices have fallen, no big deal. Maybe. But I promise you, placing a well-timed option will bring immense profits. While I have no proof of such trades occurring, my mind boggles. I cannot prove nor am I trying to. There are no conspiracy theories here. All we have are observations. And as for whether they are accurate, your guess is as good as mine.
0 Comments
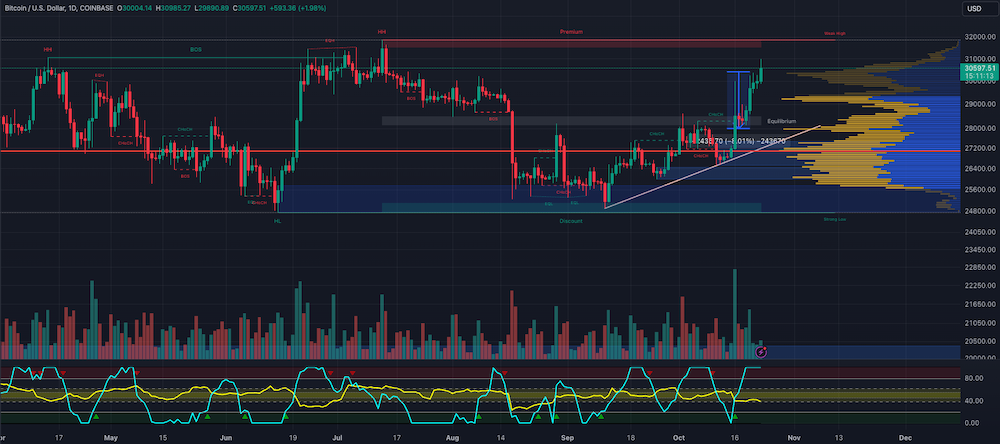
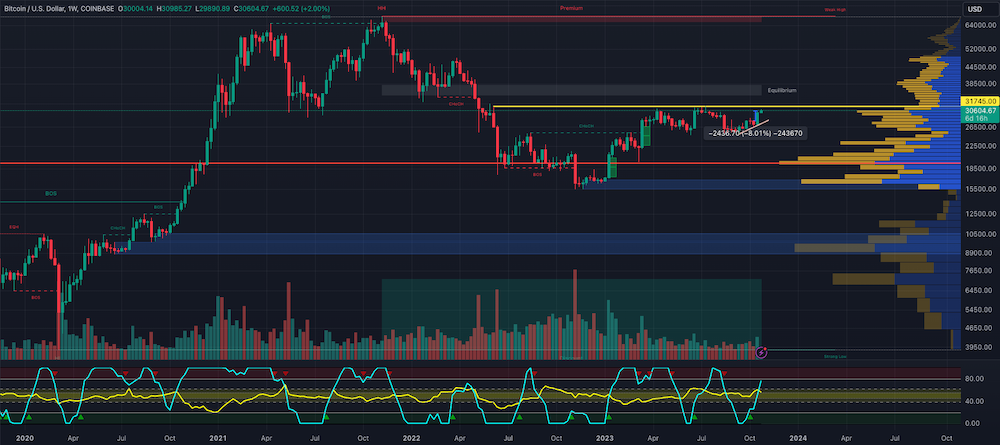
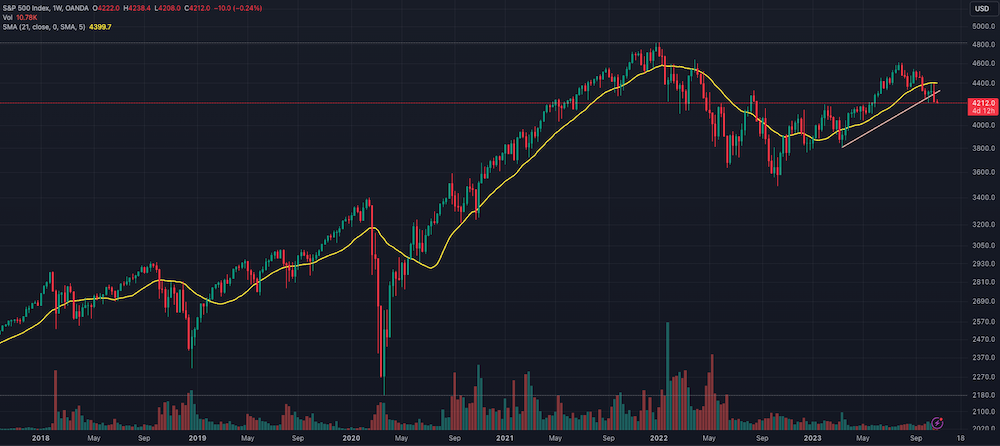
Before discussing today's topic, let me refer you to a post I put out on the 9th of October titled, "BTC: Is There Too Much Excitement?" I stated that if BTC hit the $30500 price (a move of 8%), we could be on for a bull run. Ladies and gentlemen, we have hit that price level. There is the question of what's next. Let's have a look at the charts. On the daily chart, we see that the Laguerre RSI indicating BTC is overbought. There is also the fact that the flattening of the Laguerre RSI shows a continuous price rise. The Choppiness Index shows a drop in energy to 38, which means the price may begin to fall. I think the Choppiness Index will begin to consolidate for prices to continue to rise. I also suspect that the price will hit $32k before seeing a retracement. The reason for this is that we have a weak high at this level. On the weekly, the signs are more encouraging. The Laguerre RSI shows an upward momentum and is not in the overbought region. There is also strength in the Choppiness Index - meaning there is plenty of market energy. Judging by the volume profile, we expect BTC to hit $35k. Some analysts are now warning of the price action in the S&P 500. They posit two things. One, the S&P 500 is now below its 21-weekly moving average. Two, the S&P 500 price is also below the trend line. They believe that we must be concerned with this development. It means that these two signs indicate a fall in the overall market and the price of BTC. It will be interesting to see what happens as time goes on. As analysts, we can only posit based on experience, but no one can tell you what will happen. When we forecast, we hope it is in the right direction. Other than that, your guess is as good as mine.
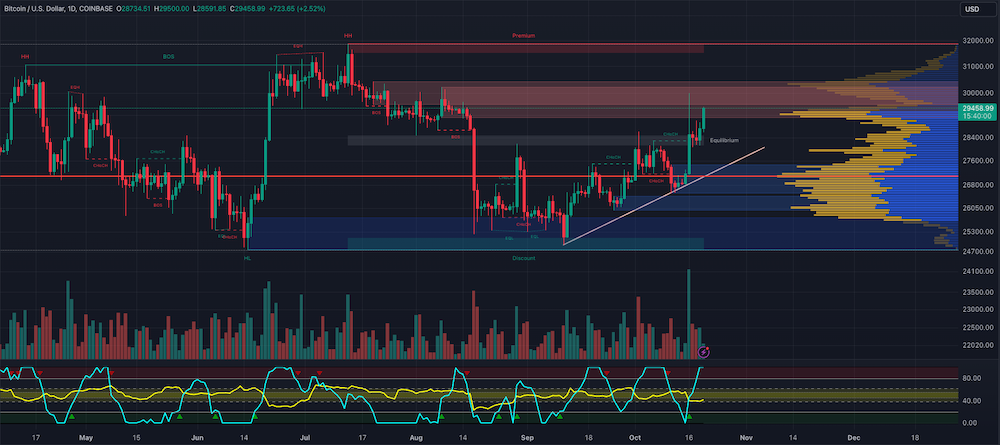
You may have taken your eyes off the ball when Bitcoin blasted its way to US$30k. In other words, you were busy with other matters. I was one of such people. On the evening of Monday the 16th, I got my first chance that day to look at the charts. To my surprise, I see the BTC price at US30k. I did wonder what brought this about. As I looked into it, reports surfaced that the approval of a BTC ETF (Exchange Traded Fund) is imminent. These reports were false and rumours. In the world of crypto, a day is a very long time. These rumours now have some validity. The SEC's (US Securities and Exchange Commission) recent losses in court have contributed to the excitement that there will be a BTC ETF before the end of the year. Institutional players, including BlackRock and Cathie Wood's ARK, are clamouring for this. It seems the tide has turned. A look at the charts tells us a lot. First, a new series of higher highs and higher lows indicates increased activity in the market. Second, the price broke through a confluence of institutional selling at price points between $29k and $30.2k. Many analysts believe $35k is possible. Some have gone as far as $40k. Finally, the series of higher highs and higher lows emanate from areas of institutional buying. The Laguerre RSI at 100 indicates that BTC is overbought. While the Choppiness Index has barely enough energy for a price push. These indicators tell us that prices may fall. Nevertheless, with the rumours swirling around, investors may be too enthusiastic to have a correction. So, do rumours conquer all? Sometimes, I guess. And as for the optimistic bets of $40k BTC, your guess is as good as mine.
The idea of crowd-sourcing modelling predates AI/Financial prediction firms. In addition, the concept of using models to predict financial prices or market direction came into play. What was missing was putting the two together. Perhaps the Achilles heel of this problem was data. Data was the glue to combine the two variables. No one with a good dataset would share it with the world as this was proprietary. Data is proprietary because it is difficult and expensive to gather and make useful for production. Without the ability to share proprietary data, there could be no crowd-sourcing. The solution to this problem was the encryption of data. While this was the right solution, another problem emerged. Encryption renders the data unusable; in other words, data loses all predictive structure. Solving the puzzle of keeping the predictive nature of data was the final key. The development of new encryption algorithms helped solve the problem of usability. By solving this problem, finance firms were free to crowd-source their predictions. Data encryption also solved the issue of bias. If data scientists knew what stock they were predicting for, their bias could lead to overfitting of data, hence the production of poor models. With this issue solved, the untapped programming and data science talent could now access excellent production-ready data. We now come to CrunchDao. While other firms are offering similar services, CrunchDaos’ offering is unique. It is not a hedge fund but a platform that powers financial institutions like hedge funds. With this, CrunchDao can aggregate different hedge funds, which creates more revenue streams and a robust business. It powers financial institutions via alpha signals its army of data scientists generates. So, what makes CrunchDao the best quant/ml competition? First, it is a pure DAO. DAOs ensure that every decision receives consent from all members. Any member can submit a proposal for improvements or changes to any matter of concern. Members then vote on the proposal. If they approve, it goes through; if not, put aside. You are certainly not going to get this in a hedge fund. And by the way, its data scientists are called "Crunchers". In addition, CrunchDao is open to all; anyone can join. Secondly, and perhaps most importantly, the quality of data. CrunchDao has made very clean and well-prepared data for immediate use. As mentioned, a data scientist may use the data immediately or perform exploratory analysis. Gathering data is expensive, but CrunchDao did not spare that expense. Thirdly, the competition objectives are clear: generate alpha and sell the signals. Having a clear direction means that CrunchDao can now have as many competitions as possible. At the moment, CrunchDao only develops alpha for stocks. CrunchDao can have alpha development for commodities, cryptocurrencies, and derivatives. The options are endless, meaning CrunchDao is agnostic in terms of assets. Fourth, we talked about compensation, but needs another look. There is also the flexibility of distribution in payment. Crunchers receive payment via the Dao structure in a token known as Crunch. The more competitions there are - the more compensation for the Crunchers. However, there is a contest - ADIA Labs -, which will pay in United States dollars. In addition, CrunchDao is looking at matters of internships, jobs, and other ways to recognise achievement. Fifth, we come to the matter of learning resources. The community meets on Discord, where ideas are expressed and shared. There are also papers, articles, and book titles on quant finance, machine learning and more. CrunchDao is also a very active participant in the new community of Decentralised Science (DeSci). DeSci is a movement that aims to use blockchain technology to make scientific research more open, transparent, and accessible. CrunchDao has created an environment for all participants of its competitions to submit research proposals and share research. It is worth noting that while DeSci holds promise, this is an emerging concept, and its widespread adoption is ongoing. No other organisation is providing this level of excitement and development. And there is more to come. We all know we are competing in a weekly tournament, but it does not feel like a tournament. Borrowing the word co-opetition feels more appropriate. One can only give the utmost respect to the men and women of CrunchDao - the crunchers - as they code for alpha. With that said, there is one message for all crunchers - "May thy code crunch and shatter. Long live the crunchers!" If interested in being part of this competition, please see here for details: https://nosax.me/crunchDao
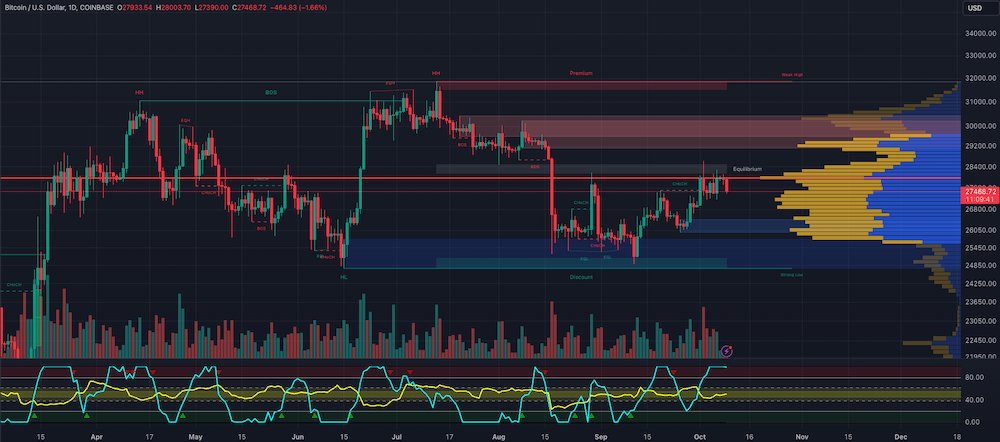
There has been a lot of excitement about the BTC price movement. We have had the punditry come out with all sorts of predictions. It is no surprise to anyone; it is what we should expect. Is there room for excitement? Perhaps! Let us look at the evidence. Let's start with the charts. First, the BTC daily chart reveals that the point of control (PoC) acts as resistance. In addition, we are at an equilibrium point. Equilibrium is the state of the market where demand and supply are in balance with the price, indicating that the market price is at fair value. For the price of BTC to rise, it needs to break through not just the PoC but the equilibrium. Above both the equilibrium and the PoC, we have a large area of institutional selling (maroon in colour). We may see this area act as resistance. Institutional selling is $29140, a 3.91% move to the upside from the PoC. BTC has moved higher in the past; nevertheless, equilibrium needs consideration. Third and finally, the Laguerre RSI value. Currently, the Laguerre RSI has a reading of 100. The Laguerre RSI may remain at this value for a while but eventually fall. A value of 100 means BTC is overbought at current levels. For the excitement to be palpable, we will need BTC to hit the $30500 level, a move of over 8%. When BTC breaks that price, I believe we will have a great bull run. So, when will this happen? I know not. If you do, then your guess is as good as mine. To be part of this competition, please see here for details: https://nosax.me/crunchDao
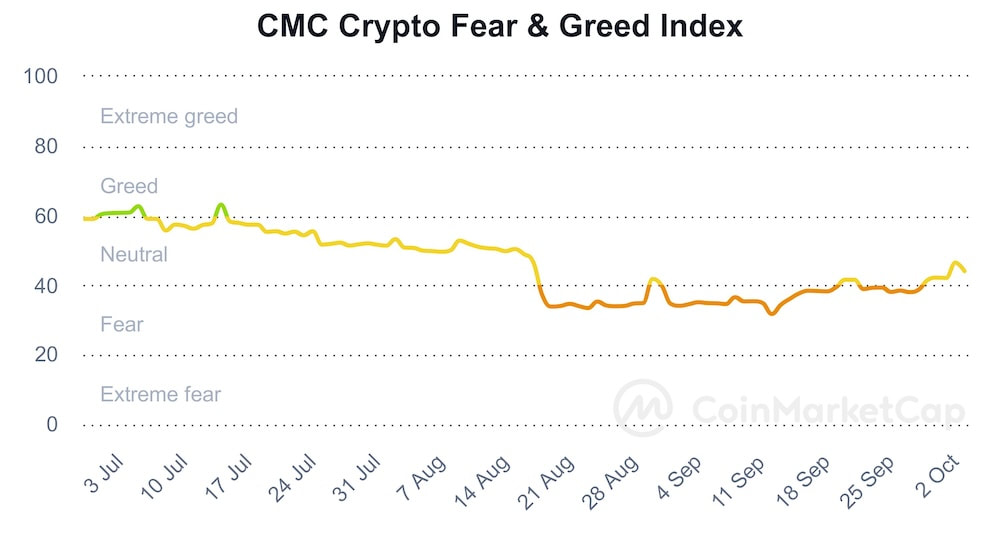
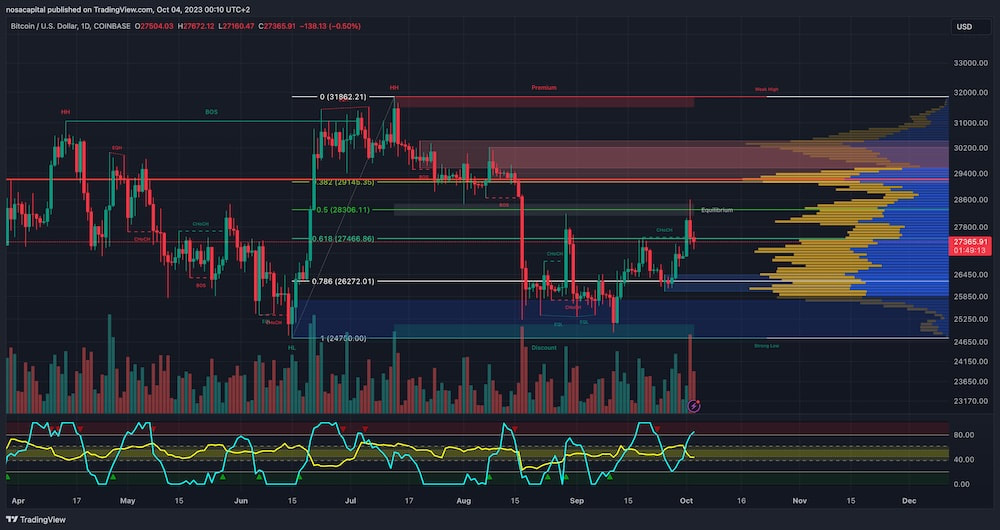
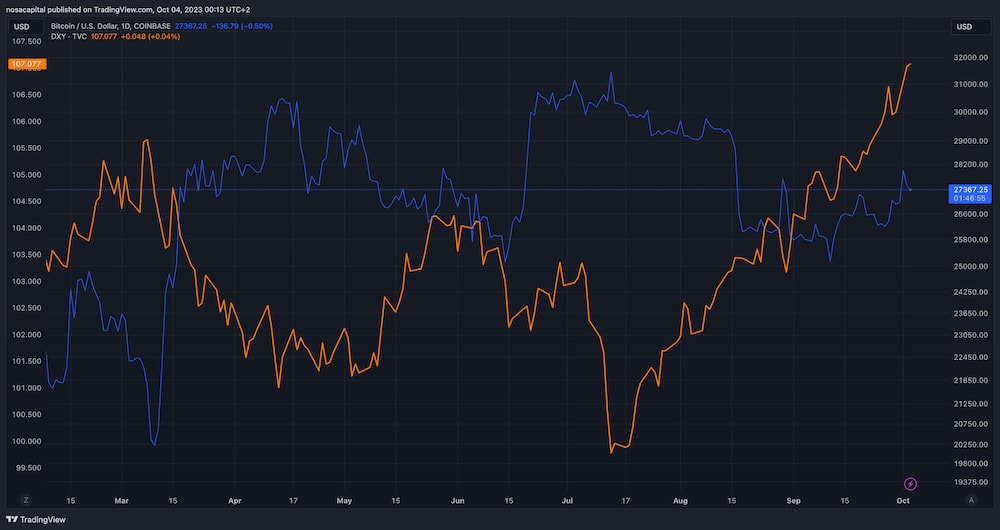
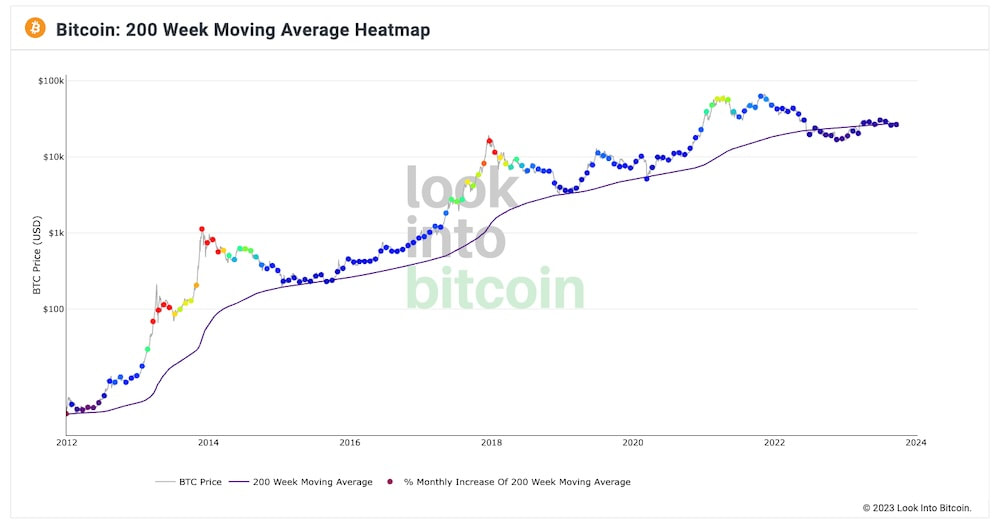
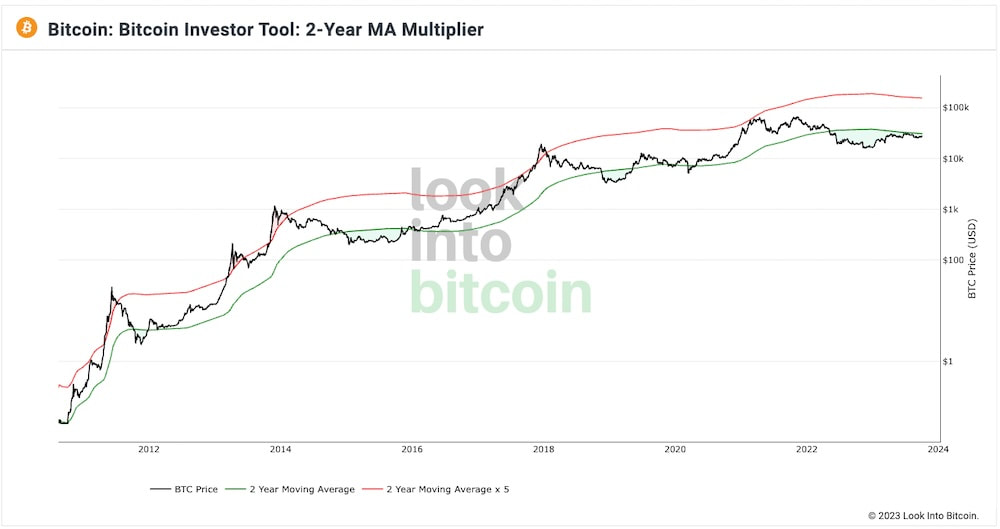
One big moment late last week was the announcement by the government of the United States not to shut down government functions. Many believe this brought about a spike in the BTC price. I am not in complete agreement with this opinion. One reason is the sudden spike in price on Sunday, the 1st of October. Nothing was happening over the weekend to warrant such a price spike. Perhaps there was the fear of a short squeeze. Nevertheless, vagaries in the crypto market come as no surprise. Without the obvious answer, let us look at a few possible factors. A look at the Fear & Greed Index tells us that there is investor uncertainty. We are currently at a rate of 44, which signifies a neutral sentiment. The volume profile reveals that the point of control (PoC) acts as a point of resistance but turns to support. Laguerre RSI shows that it is in the overbought territory. The choppiness index also indicates it is getting low on energy at just under 43. While there is promise of a price rise, there are points of concern. For instance, the current price is below the Fibonacci 61.8% level. We may see the price falling further. The US Dollar Index (DXY) is also showing strength. When the DXY shows strength, the price of BTC tends to fall. These two instruments show an inverse correlation. Finally, onchain analytics has a few things to say. Let us look at just two indicators. The 200-week moving average heatmap reveals something significant. In each of its market cycles, Bitcoin's price historically bottoms out around the 200-week moving average. Historically, when we see orange and red dots assigned to the price chart, this has been a time to sell Bitcoin as the market overheats. When the price dots are purple and close to the 200-week MA, these have historically been good times to buy. We see this with the current price of BTC. Another good indication of BTC buying is the 2-year MA Multiplier. We also see that buying BTC should occur when the price is below the green line and selling when above the red. There can be no question; some are accumulating, while some have made a quick profit. I suspect that the price action will surprise us. We should be ready before the price takes off. It is all we can do or must do. And when will this happen? All I can say is your guess is as good as mine.
|
Swap your cryptos here:
Nosa Capital
Nosa Capital concentrates its' expertise in Strategy, Business Development, Project Management, Project Finance, Trending, and now cryptocurrencies Archives
November 2023
Categories
All
|
Photos from QuoteInspector, wuestenigel, Hektorej, SimpleFX, verchmarco, barbourians, Bestpicko, Noam A., verchmarco, verchmarco, wuestenigel, wuestenigel (CC BY 2.0), Casinolobby.dk, mr.ddenisov, focusonmore.com (CC BY 2.0), PerfectHue, b_d_solis, davidstewartgets, wuestenigel, afiler, wuestenigel, verchmarco, SimpleFX, nodstrum, wuestenigel, verchmarco (CC BY 2.0), wuestenigel, sirqitous, TheAlieness GiselaGiardino²³, QuoteInspector, wuestenigel, marcoverch, Jorge Franganillo, verchmarco, wuestenigel, wuestenigel, wuestenigel, wuestenigel, Jorge Franganillo, wuestenigel, TLC-kios, SimpleFX, SimpleFX, wuestenigel, wuestenigel, wuestenigel, wuestenigel, verchmarco, wuestenigel, Infosec Images, ttmarketing, Toolstotal, SimpleFX, wuestenigel, marcoverch, wuestenigel, focusonmore.com, Cryptodost, zcopley, btckeychain, Crypto360, QuoteInspector, wuestenigel, davidstewartgets, trendingtopics, Raisin - Finance Stock Images, wuestenigel, stockcatalog, verchmarco, focusonmore.com, wuestenigel, TwinPeaks99, orgalpari, marcoverch, orgalpari, arne-mueseler.com, orgalpari, Bestpicko, Jim Makos, wuestenigel, jane.boyko, Infosec Images, verchmarco, SimpleFX, stockcatalog, Bestpicko, mikemacmarketing, wuestenigel




 RSS Feed
