|
Last week, Rolling Stone magazine published an article on their website titled, "Your NFTs Are Actually — Finally — Totally Worthless". At first glance, it seemed the article was saying NFTs were dead. On further study, it was not the case. A closer look reveals that they were quoting from a report by dappGambl.
The dappGambl report titled - Dead NFTs: The Evolving Landscape of the NFT Market - took a closer look at the high-end NFTs. I decided to read the study and give an opinion. In addition, I also talk about NFT sales on Opensea and Exchange Art.
If you are having problems with the Audio player, please download the mp3 here: https://nosax.me/48Gz6oy
0 Comments
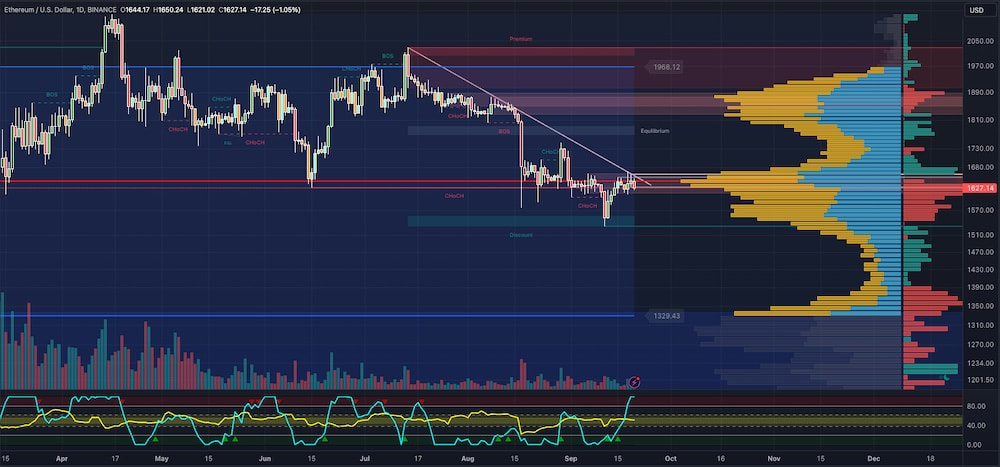
The gods of crypto must forgive investors in ETH if they believe hardly anything is happening with this cryptocurrency. ETH charts show nothing of excitement. We have a point of control (PoC) at $1627, which ETH price action has barely been able to surpass. When it does so, it falls back down. We may lean on the following to make a case for the current disposition. The choppiness index shows that there is still plenty of energy left in the market. It currently sits at 50.92. At 50.92, there is enough energy to support the formation of a trend. Please remember that the choppiness index does not determine the trend direction. What determines a trend direction is the Laguerre RSI. A few days ago, the Laguerre RSI hinted at an increase in price. This rise was short-lived as the price action trended sideways. Perhaps the best indication of a lack of a clear direction is the volume profile. The ETH/USD chart shows the volume profile on the right. We see that the volume profile has two areas of low-volume nodes or low-volume areas. These are sections of the price chart where trading activity and volume are relatively lower. Traders and analysts often pay attention to these areas as they can provide insights into levels of support or resistance. In addition, indicate areas where price may consolidate or experience a breakout. So, what are the possibilities? If the price breaks to the upside and surpasses $1661, we may see an ETH price of $1825. On the other hand, if the price falls below $1530, we may see an ETH price of $1329. Both sound ridiculous, hence, perhaps the confusion. Of course, there are variables to help with the price levels up or down. The one thing to determine is if the price is at the bottom, with no further to fall, hence the confusion. We must be vigilant and monitor price levels carefully. And as for how the price will move, your guess is as good as mine.
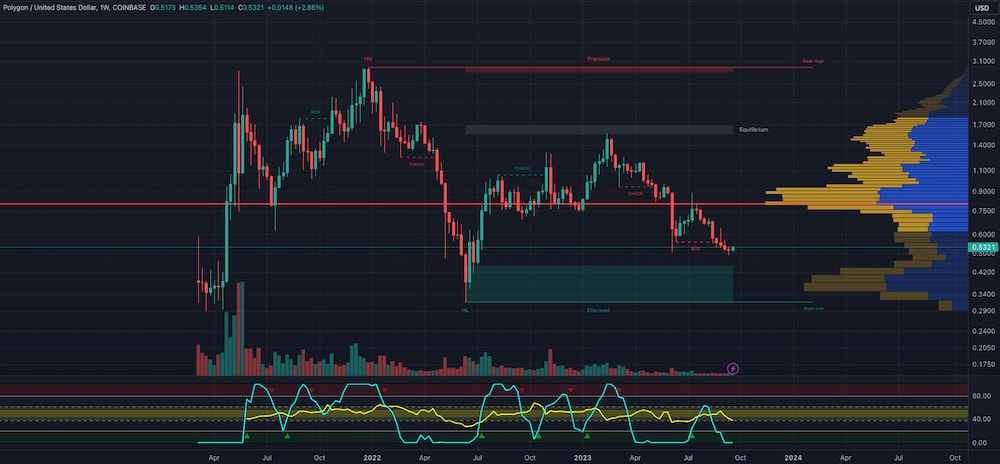
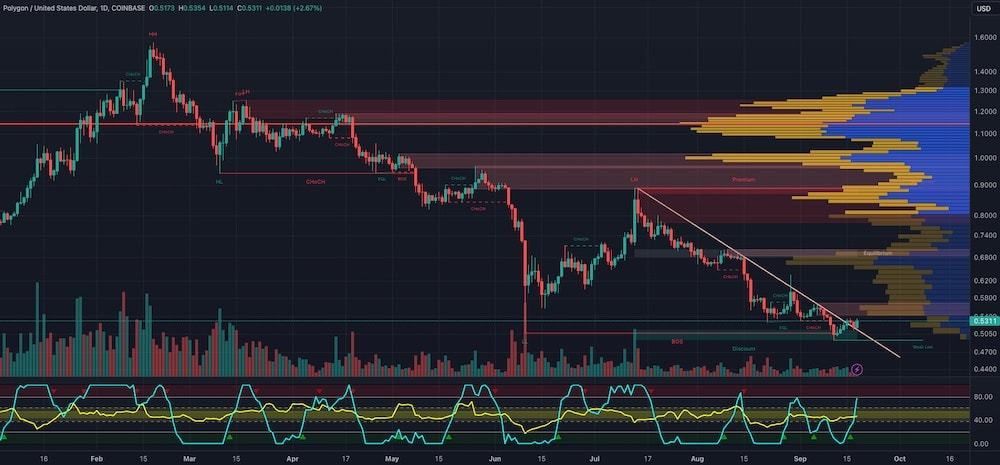
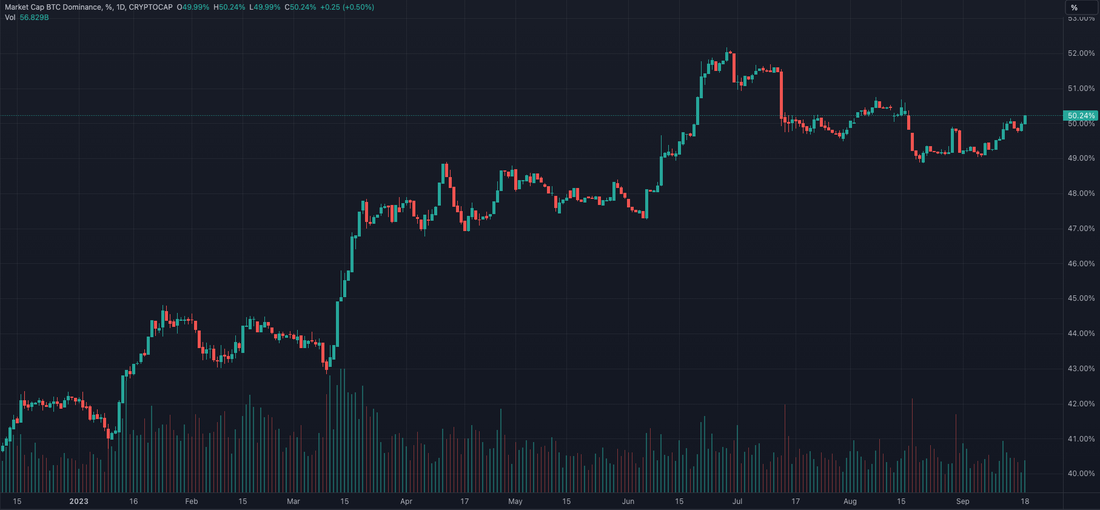
Quite a few things have happened in the life of MATIC. For starters, MATIC is now called Polygon, with a new symbol, POL. I must admit some confusion. There is a cryptocurrency called Proof of Liquidity with the same crypto-symbol POL. Although this crypto is less than one US cent, having the same symbol is still baffling. Anyway, we are not discussing crypto-symbols but currencies. Let us start with the weekly chart. Laguerre RSI is flat, indicating that the price is likely to have bottomed out. The choppiness index is currently at a value of 38.02. What this means is the use of a considerable amount of energy. You can expect non-linear behaviour, such as a one-day pullback. Few trends come to an abrupt end, but probabilities have increased for a reversal or consolidation. Nevertheless, when the higher timeframe shows weakness in market energy, we must pay attention and be alert. On the daily chart, we see a series of lower highs and lower lows. A downward trend, if there ever was one. Earlier in the day, MATIC's price was $0.51, touching the discount region. It is most likely we will see a revisit of the discount region. The reason is that right above the price action lies above the price. This area also acts as resistance and may do so again. When I mention the glory days, I mean when MATIC was almost $3.00. Considering the current price range of MATIC, its price has fallen some 83%. It will likely take a while before we return to the heady days of $3.00. When we look at BTC dominance, we might want to bear in mind that liquidity is leaving the Altcoins and going to Bitcoin. As long as this continues, we can expect a bumpy ride in the price of MATIC. Finally, please don't ask for a future price, because your guess is as good as mine.
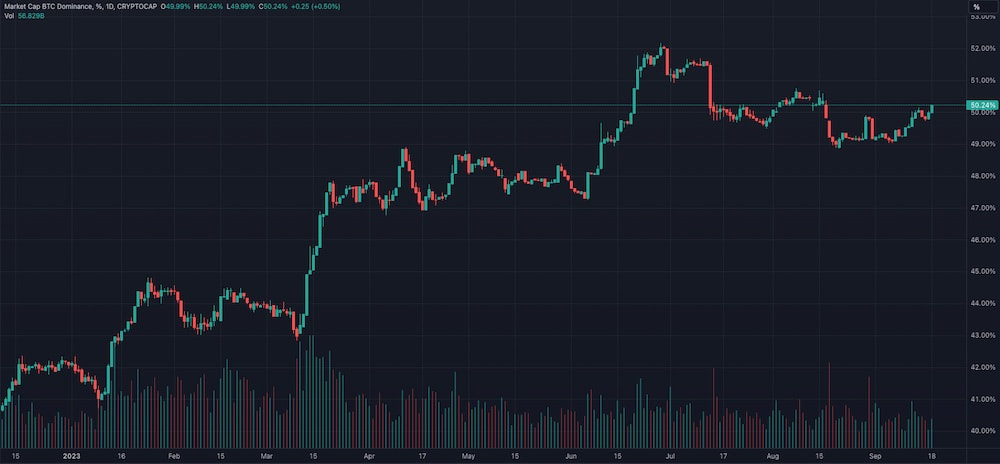
You constantly hear of a new altcoin season, but all that happens is lower price levels. The most influential element in this equation is Bitcoin dominance. Bitcoin dominance is the ratio of the market capitalization of bitcoin to the rest of the crypto market. Bitcoin dominance = Bitcoin market cap/ Total cryptocurrency market cap Just in case you don't understand, the calculation for Bitcoin market cap is as follows: Bitcoin market cap = Bitcoin price X Bitcoin circulating supply Investors and traders of cryptocurrencies use bitcoin dominance to adjust their trading/investment strategies. The other characteristics of a higher Bitcoin dominance are the following:
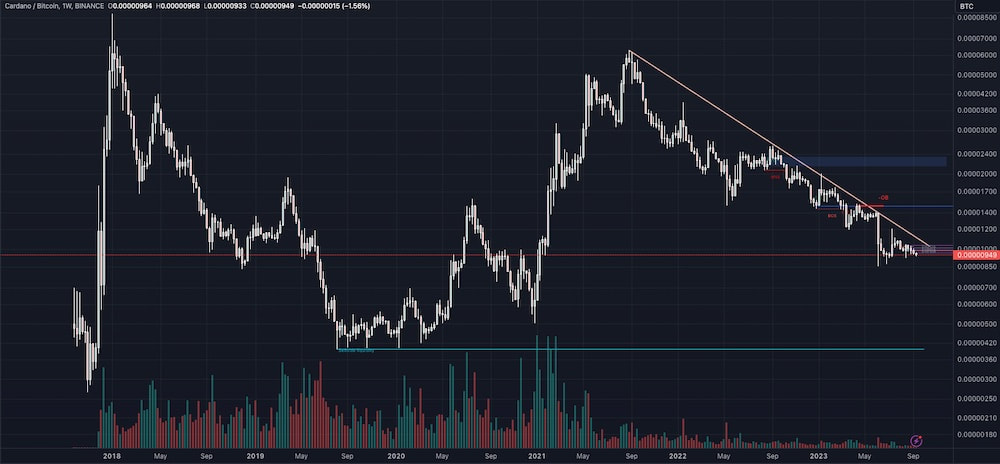
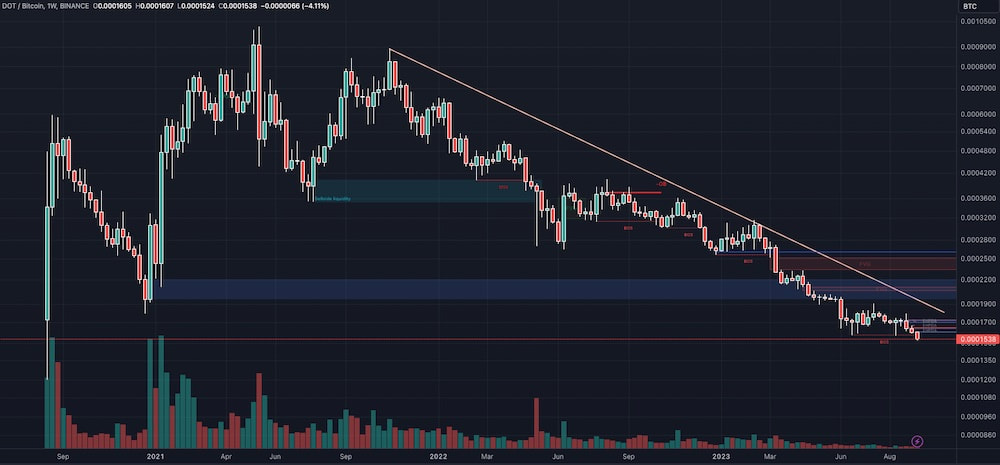
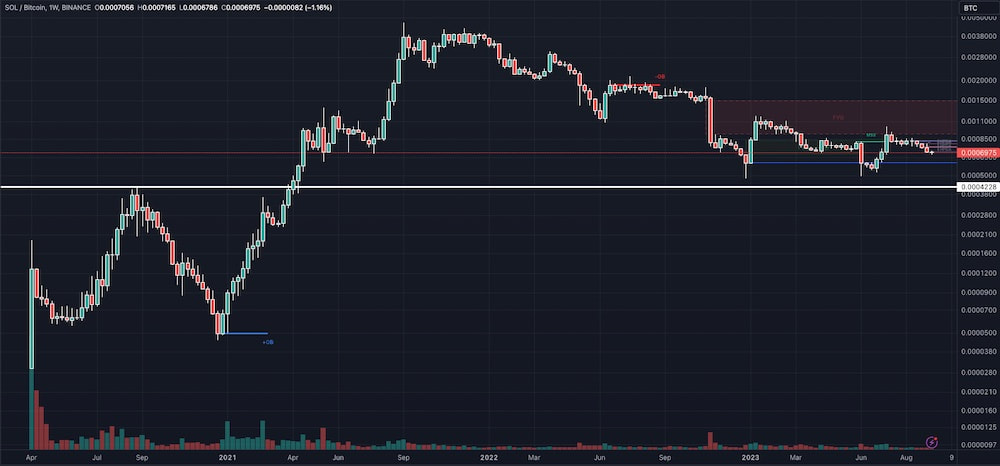
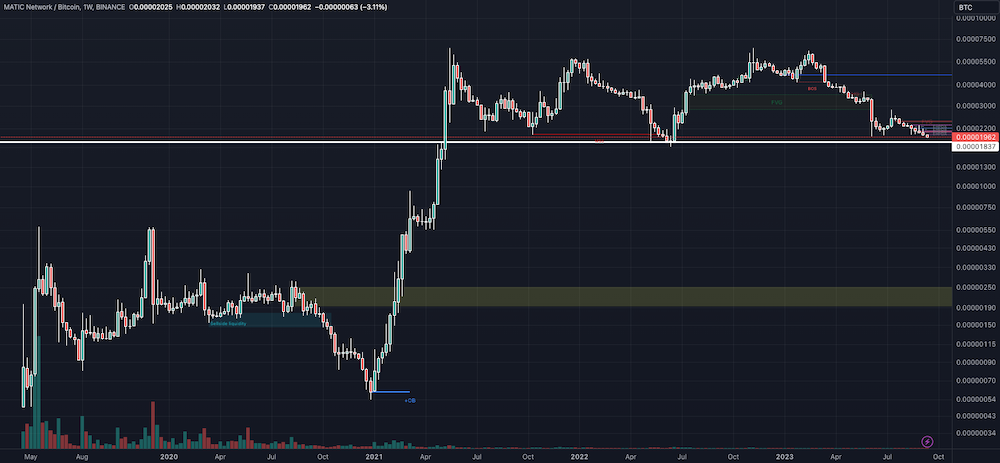
There are other things we could discuss, but these are beyond the scope of this blog. What I will say is that there is a simple strategy anyone can follow with these two moves. First, know when we are in a bull or bear market, and follow the BTC dominance as it happens. If BTC dominance increases, we will likely be in a bear market. If BTC dominance decreases, then we are in a bull market. Second, pair your favourite altcoin with Bitcoin. When the price falls against BTC, it means staying out of the investment. Otherwise, do the opposite. Let us now look at a few examples. We will start with Cardano; remember, we will pair ADA with BTC. To capture as much information as possible, the timeframe applied is weekly. ADA's price trajectory since August of 2021 has been downward. It means the price of ADA is falling relatively to that of BTC. Hence, it would be advisable not to put resources into this cryptocurrency. Next is Polkadot (DOT). As you can see, this is very similar to the ADA chart. Again, the price of DOT is falling relative to that of BTC. Hence, one should not invest in this cryptocurrency. Now we look at Solana (SOL). Here we have something different. While we have a downward trajectory in price, it is not as steep. It requires us to watch this pair closely. We also see that as long as the price does not fall below the white line, the SOL/BTC pair remains promising. The MATIC/BTC chart is also similar to the SOL chart. We can see that the price action with this pair is sideways. We also see that the white line gives us a target area to observe. Breaking through the target area means we hold our current position and make no commitment to obtain any MATIC. This analysis is highly simplified, but observations like these will help you make quick decisions. Of course, this is not financial advice, but this should help. Your due diligence and research are mandatory before committing any money. What remains is when Bitcoin's dominance will change, and of course, altcoins will become exciting once more. As for that, your guess is as good as mine.
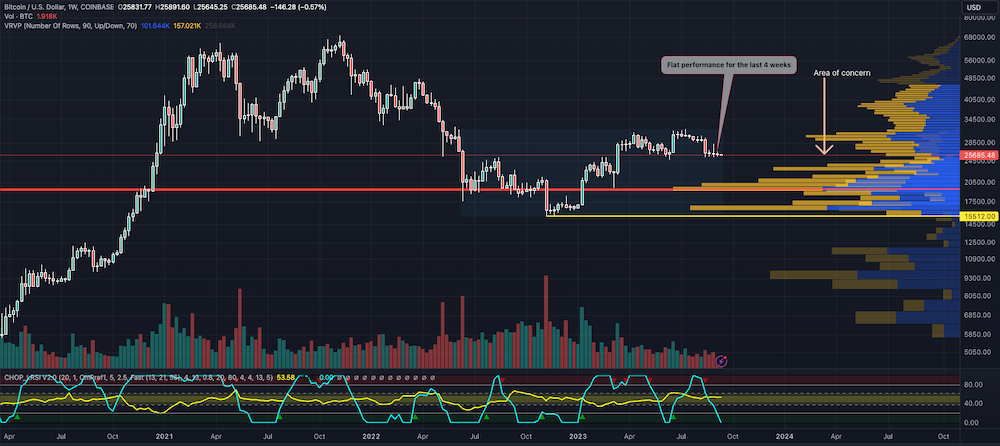
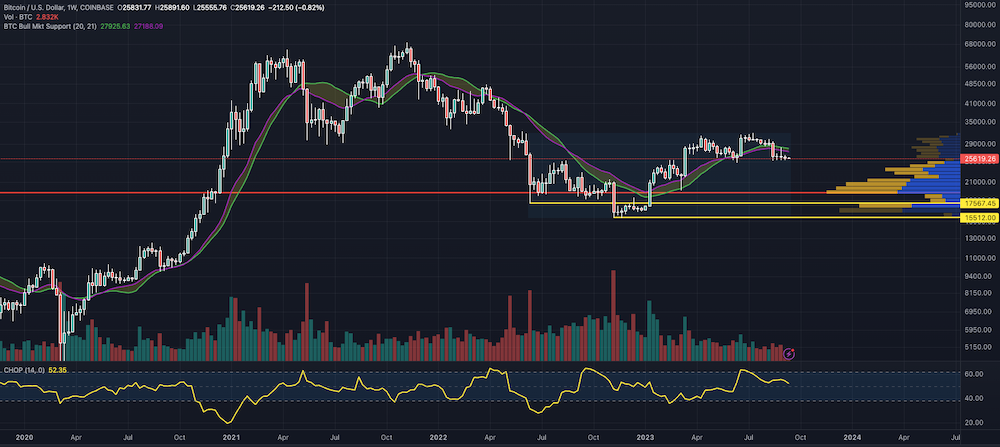
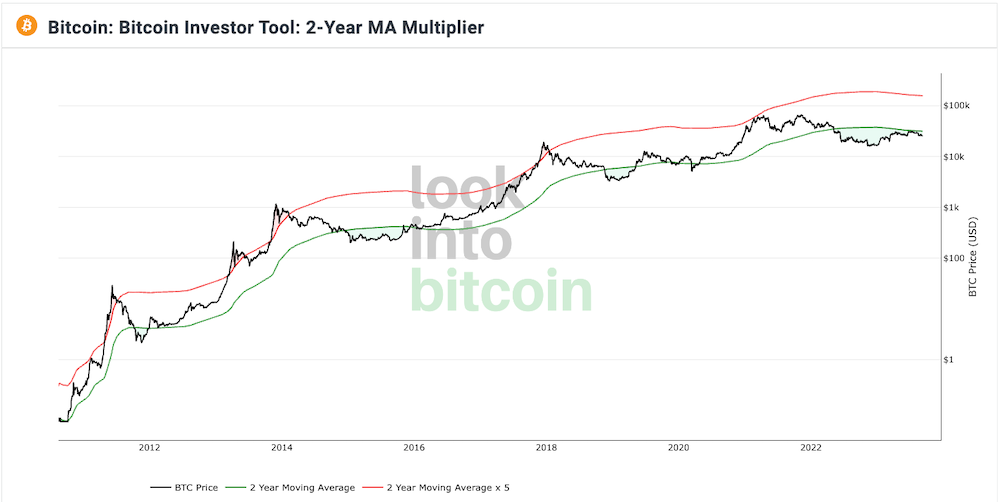
I believe a brief look at BTCs' weekly performance is in order. A glance at the chart shows no excitement in the slightest. The last four weeks have been flat. There is also an area of concern via the volume profile. When a volume profile shows a lack of volume in a particular price area, the price will rise or fall rapidly. BTC price is $25723, with the potential to drop to $23500. I must emphasise that this is not guaranteed to happen. Another price point is at the Point of Control (POC) at $19500. Price does love to move towards the POC. In an extreme case, we might even see a fall to a low of $15500. At the moment, this looks highly unlikely. In addition, let us not forget that the Laguerre RSI is on a downward trend with a high enough energy via the choppiness index. Finally, the bull market support chart helps clarify this point. The bull market support comprises the 21-weekly EMA and 20-weekly SMA. The range we are looking at between these two indicators is $27193 to $27928 (respectively). BTC prices are well under these ranges. It may take a while to be clear of these price points and rise even higher. Despite the lacklustre BTC price, the on-chain indicator 2-year Moving Average (MA) Multiplier might give some comfort. The indicator functions as follows: buy BTC when the price drops below the 2-year MA (green line). Sell BTC when the price is above the 2-year MA x 5 (red line). Price is below the green line; a case for buying BTC, some might say (no financial advice). Predictions/forecasts are fools' luck. No one can tell where the price will head to. Perhaps you have a crystal ball to predict accurately. If not, your guess is as good as mine.
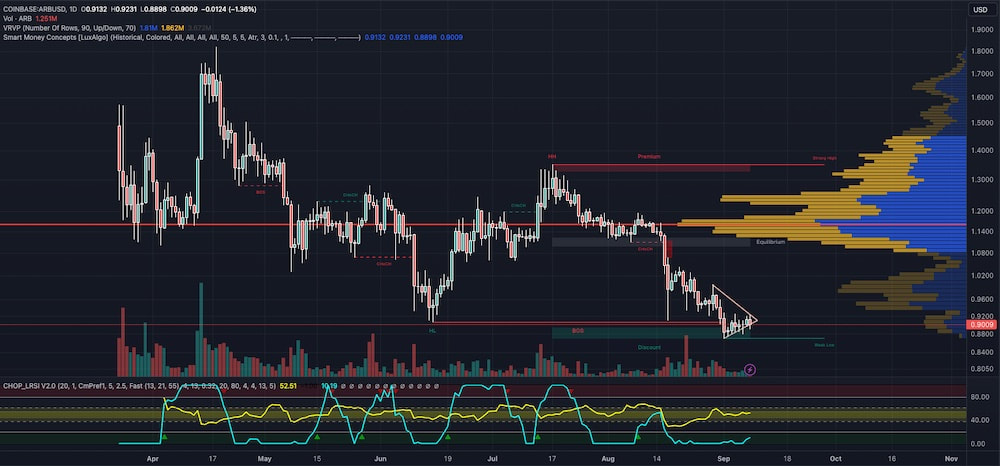
I heard of Arbitrum (ARB) but had not paid that much attention to it. What got me to look at ARB more seriously was Mirror. XYZ. Arbitrum is a layer-2 scaling solution for the Ethereum blockchain. It aims to improve the performance of Ethereum smart-contracts by increasing their speed, scalability, and privacy. We all know that using the Ethereum blockchain for payments has been a nightmare in terms of costs to the user. Sometimes, the Ethereum blockchain is unusable due to a lack of scalability to deal with a backlog of payments. ARB is a much cheaper alternative and scales effectively. I think we best stop here; this blog is not about discussing the virtues of ARB. The ARB chart shows that the current price of $0.90 is close to the all-time low of $0.87. One might say that this is a buying opportunity. It probably is. We can also see a series of lower highs and lower lows, which means there is a possibility that the price may have further to fall. We must pay attention to the price action as the choppiness index has enough energy to affect the fall. In addition, the Laguerre RSI indicates weakness in the price action overall, with no movement to the upside. The discount area on the chart acts as support, as seen over the last few days. No one knows what will happen; we can only make educated guesses. Since that's all we have, your guess is as good as mine.
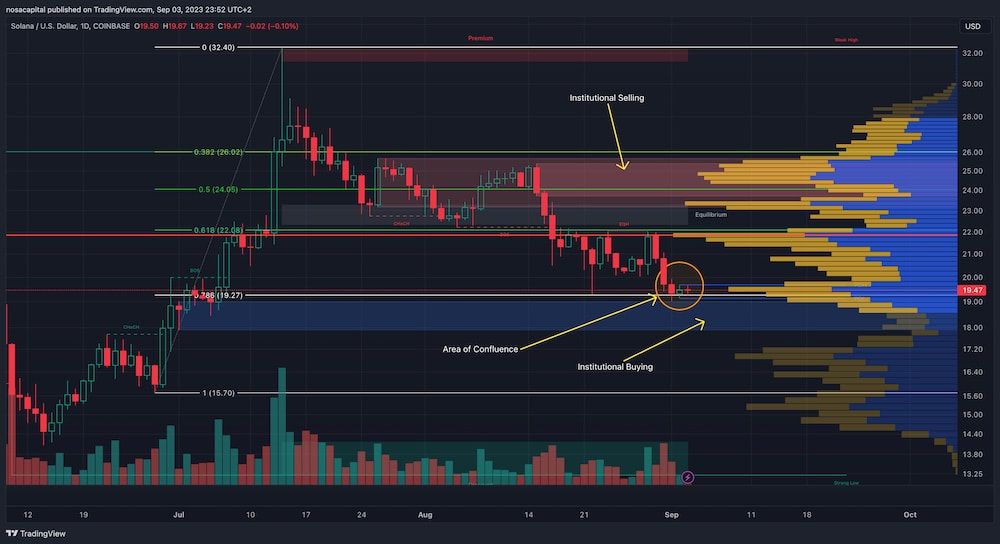
My last post on Solana mentioned briefly that just like any other instrument, Solana is subject to the vagaries of the market. The price of SOL spiked by 3.5% in 24 hours. Once I saw the spike, I knew some news triggered the reaction. While a busy day, I took time to find out what exactly caused the jump. It turns out that Visa had announced it would begin to send USDC to selected merchants via the Solana blockchain. No doubt, this is good news for Solana and its supporters. And yes, exciting times ahead. Putting the initial euphoria aside, the price of SOL is down from $20.60 to $19.81 (at the time of writing). On Monday, we discussed the price movement of SOL. The confluence between the 78.6% Fibonacci level, the point of control (POC), the institutional buying zone, and the price remains unchanged. As posited on Monday, the Solana price may still fall to $17. If SOL breaks the $19 level, the chances of falling to $17 are more relevant than ever. We must not be surprised if institutional buying acts as a strong support for the price levels. Solana investors are going to have to be vigilant on this one. Just as the price spiked upward, the same can happen heading downwards. No one knows what the market will do except if you have a crystal ball. And if you don't have one, your guess is as good as mine.
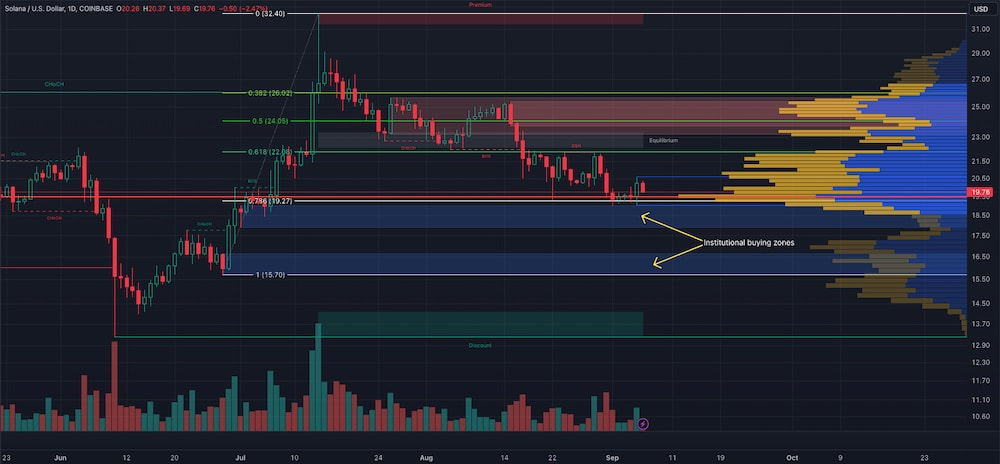
Many of you following me will know I have never analysed Solana at any level. Solana is a proof-of-stake Layer 1 Blockchain that offers users fast speeds and affordable costs. There are a variety of projects built on Solana, such as the support for smart contracts, DeFi, social media platforms, and NFT marketplaces. One can say that there are good times ahead in this project. That said, we are not here to talk about the virtues of Solana but the charts. The overall cryptocurrency is in a downtrend, and we should expect a further fall. Solana is not immune to the vagaries of the market. We must be cautious in our assessment of where the market may go. The Solana chart shows the confluence between the price, the Fibonacci retracement of 78.6%, and the institutional buying zone. The volume profile shows that if the price rises, we may have a return of $22. However, if it falls, we are looking at $17 as a possibility. Although highly unlikely, the price may drop between $15.50 and $16.00. In addition, nothing in the news cycle suggests Solana is in any form of trouble. Nevertheless, the vagaries of the market do reign supreme. One might even say there is "much ado about everything". In other words, no news is good news. As always, when determining the vagaries of the markets, your guess is as good as mine.
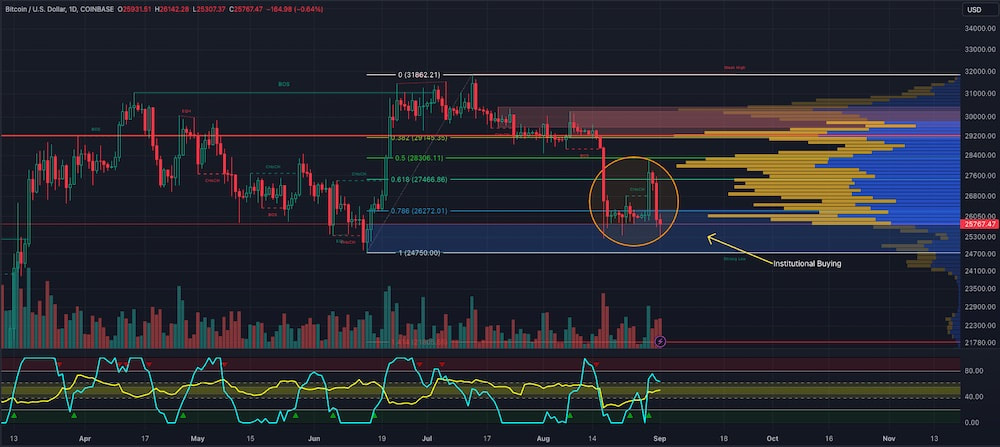
I stated two days ago that the SEC is not likely to capitulate that easily when it comes to exchange-traded funds (ETFs). Well, it looks like this has come true. There are reports that the SEC will delay the issuance of ETFs. One wonders what game the SEC is playing. Things are almost reminiscent of a banana republic. It is obvious to most that the initial euphoria of the SEC losing its case has come full circle. The price of BTC has continued to fall. For those steeped in technical analysis (TA), the charts indicated that there would be a fall in price. Nonetheless, sentiment does come into play when it involves the stock market. And that sentiment can crater any instrument. The chart shows that the 78.6% Fibonacci retracement has confluence with the institutional buying area. It also seems that this could be a new point of control (PoC) sometime in the future. The institutional buying area is going to be an area of support. Evidence of this is the congregation of prices around this area. We must remember that sentiment can easily knock the price downwards. BTC Price is $25782 (at the time of writing) and might drop to $24700. How and when sentiment may bring this about is unknown, which can only mean your guess is as good as mine.
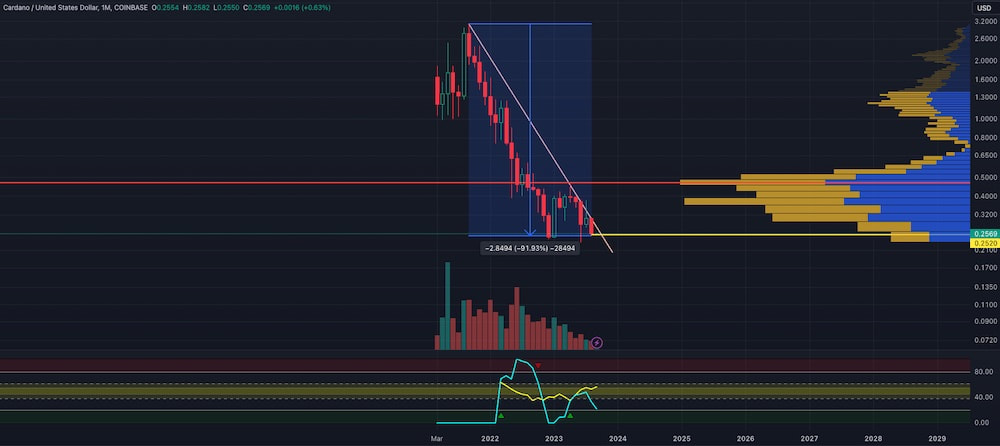
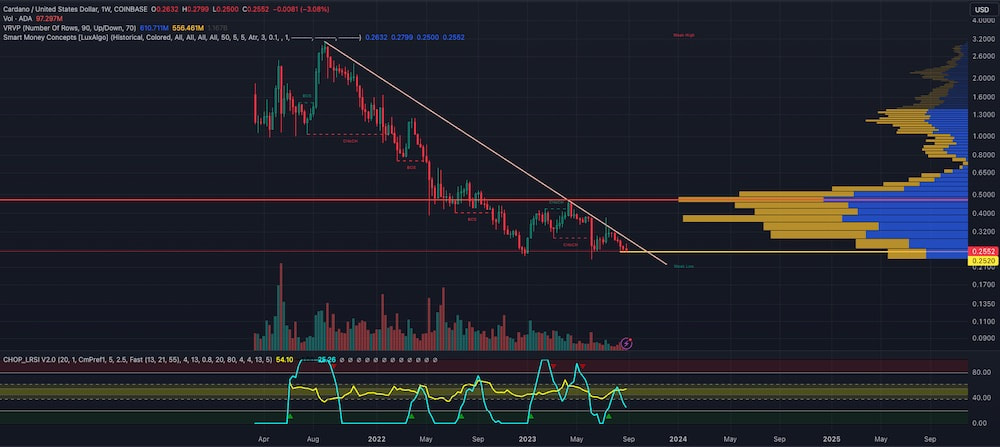
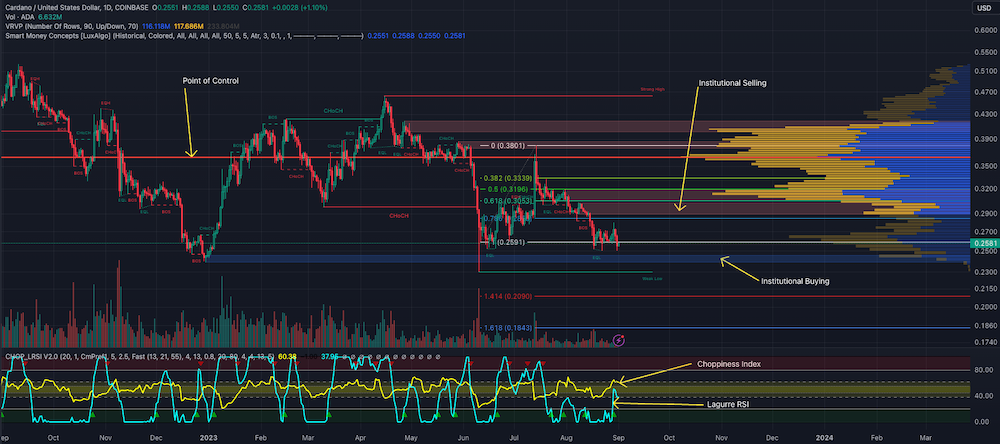
In the last couple of days, there has been excitement concerning ADA. While this is good news, I am sure the hodlers are not impressed by all the noise. Lovers of technical analysis (TA) will tell you the charts are not impressive in the slightest. Before continuing, I must disclose that I hold ADA. Those who have read my content know I never even talk about ADA. Someone close to me asked to take a quick look, hence this blog. Let us start with the monthly chart; the trend has been downhill since September 2021 to today. And there is no end in sight. Charles Hoskinson (Cardano Head-Honcho) can sing, talk, and dance all he likes, but nothing is happening. Many are getting restless. The price dropped a whopping 91.93%! A story of devastation for hodlers and the hopefuls. Now we move to the weekly. Here, we see matters more clearly. We see a series of Break of Structure (BOS) and Change of Character (CHoCH) on the chart. BOS is when the price breaks a previous higher high in an uptrend or a lower low in a downtrend. A CHoCH is when the price breaks a prior higher low in an uptrend or a lower high in a downtrend. As I write, there is a CHoCH on the chart, which means a fall. It does not look pretty. Finally, we have the daily chart. You may have noticed that I did not touch on the Choppiness Index or the Laguerre RSI. I did not forget; this was deliberate. The daily chart shows nothing new. Nevertheless, ADAs' price action is below the Point of Control (PoC). PoC refers to the most popular price level where the highest volume of trades occurred within a specified time frame. The position of the PoC in relation to the current price can provide insights into market sentiment. If the PoC is above the current price, it may indicate bearish sentiment, while if it is below the current price, it may signal bullish sentiment. Currently, the ADA price level is below the PoC. However, looking at the Choppiness Index, we can see plenty of energy at just over 60. Please remember that the Choppiness Index does not show overbought or oversold areas but energy in the market. In other words, the market can go up or down based on the amount of energy present. ADA does not appear to have anywhere to go but down. In order to add more context to the discussion, I have added the Fibonacci retracement to the chart. There is some confluence between the 78.6% level and institutional selling. This area is likely to act as resistance to the price action. ADAs' price level fell to $0.23 on June 10th, breaking through the institutional buying area. Institutional buying is likely to act as support to the price. We will see more activity by the institutions and observant retail traders. If you are a hodler or believer in the Cardano project, expect to continue this bumpy ride. As for a better ADA price, your guess is as good as mine.
|
Swap your cryptos here:
Nosa Capital
Nosa Capital concentrates its' expertise in Strategy, Business Development, Project Management, Project Finance, Trending, and now cryptocurrencies Archives
November 2023
Categories
All
|
Photos from QuoteInspector, wuestenigel, Hektorej, SimpleFX, verchmarco, barbourians, Bestpicko, Noam A., verchmarco, verchmarco, wuestenigel, wuestenigel (CC BY 2.0), Casinolobby.dk, mr.ddenisov, focusonmore.com (CC BY 2.0), PerfectHue, b_d_solis, davidstewartgets, wuestenigel, afiler, wuestenigel, verchmarco, SimpleFX, nodstrum, wuestenigel, verchmarco (CC BY 2.0), wuestenigel, sirqitous, TheAlieness GiselaGiardino²³, QuoteInspector, wuestenigel, marcoverch, Jorge Franganillo, verchmarco, wuestenigel, wuestenigel, wuestenigel, wuestenigel, Jorge Franganillo, wuestenigel, TLC-kios, SimpleFX, SimpleFX, wuestenigel, wuestenigel, wuestenigel, wuestenigel, verchmarco, wuestenigel, Infosec Images, ttmarketing, Toolstotal, SimpleFX, wuestenigel, marcoverch, wuestenigel, focusonmore.com, Cryptodost, zcopley, btckeychain, Crypto360, QuoteInspector, wuestenigel, davidstewartgets, trendingtopics, Raisin - Finance Stock Images, wuestenigel, stockcatalog, verchmarco, focusonmore.com, wuestenigel, TwinPeaks99, orgalpari, marcoverch, orgalpari, arne-mueseler.com, orgalpari, Bestpicko, Jim Makos, wuestenigel, jane.boyko, Infosec Images, verchmarco, SimpleFX, stockcatalog, Bestpicko, mikemacmarketing, wuestenigel




 RSS Feed
